ⓘ QUICK SUMMARY
Sitting at a desk all day rarely challenges your body, meaning you could be quietly losing functional muscle even if your weight hasn't changed in years. Skeletal muscle is your body's ultimate engine room—regulating blood sugar spikes, keeping your brain sharp, and powering your everyday energy levels. Checking your "muscle reserve" early—ideally before age 35—ensures you build a lasting physical buffer for decades to come. Here is how to screen your muscle mass at home in minutes using 4 easy markers: Age, BMI, Calf Size, and Grip Strength.
⚡ 30-Second Quick Muscle Screening Cheat Sheet
Fast reference guide for home evaluation
STEP 1 BMI Context
Standard Reference Range
Target = 18.5 – 24.9 kg/m²
(Weight in kg / Height in m²)
STEP 2 Finger-Ring Test
Calf Size Visual Proxy
Wrap both hands around calf. If fingers overlap easily with extra space, lower-body reserve may be below target.
STEP 3 Tape Measurement
Clinical Tape Cutoffs
Clinical Target = ≥ 34 cm (Men) | ≥ 33 cm (Women)
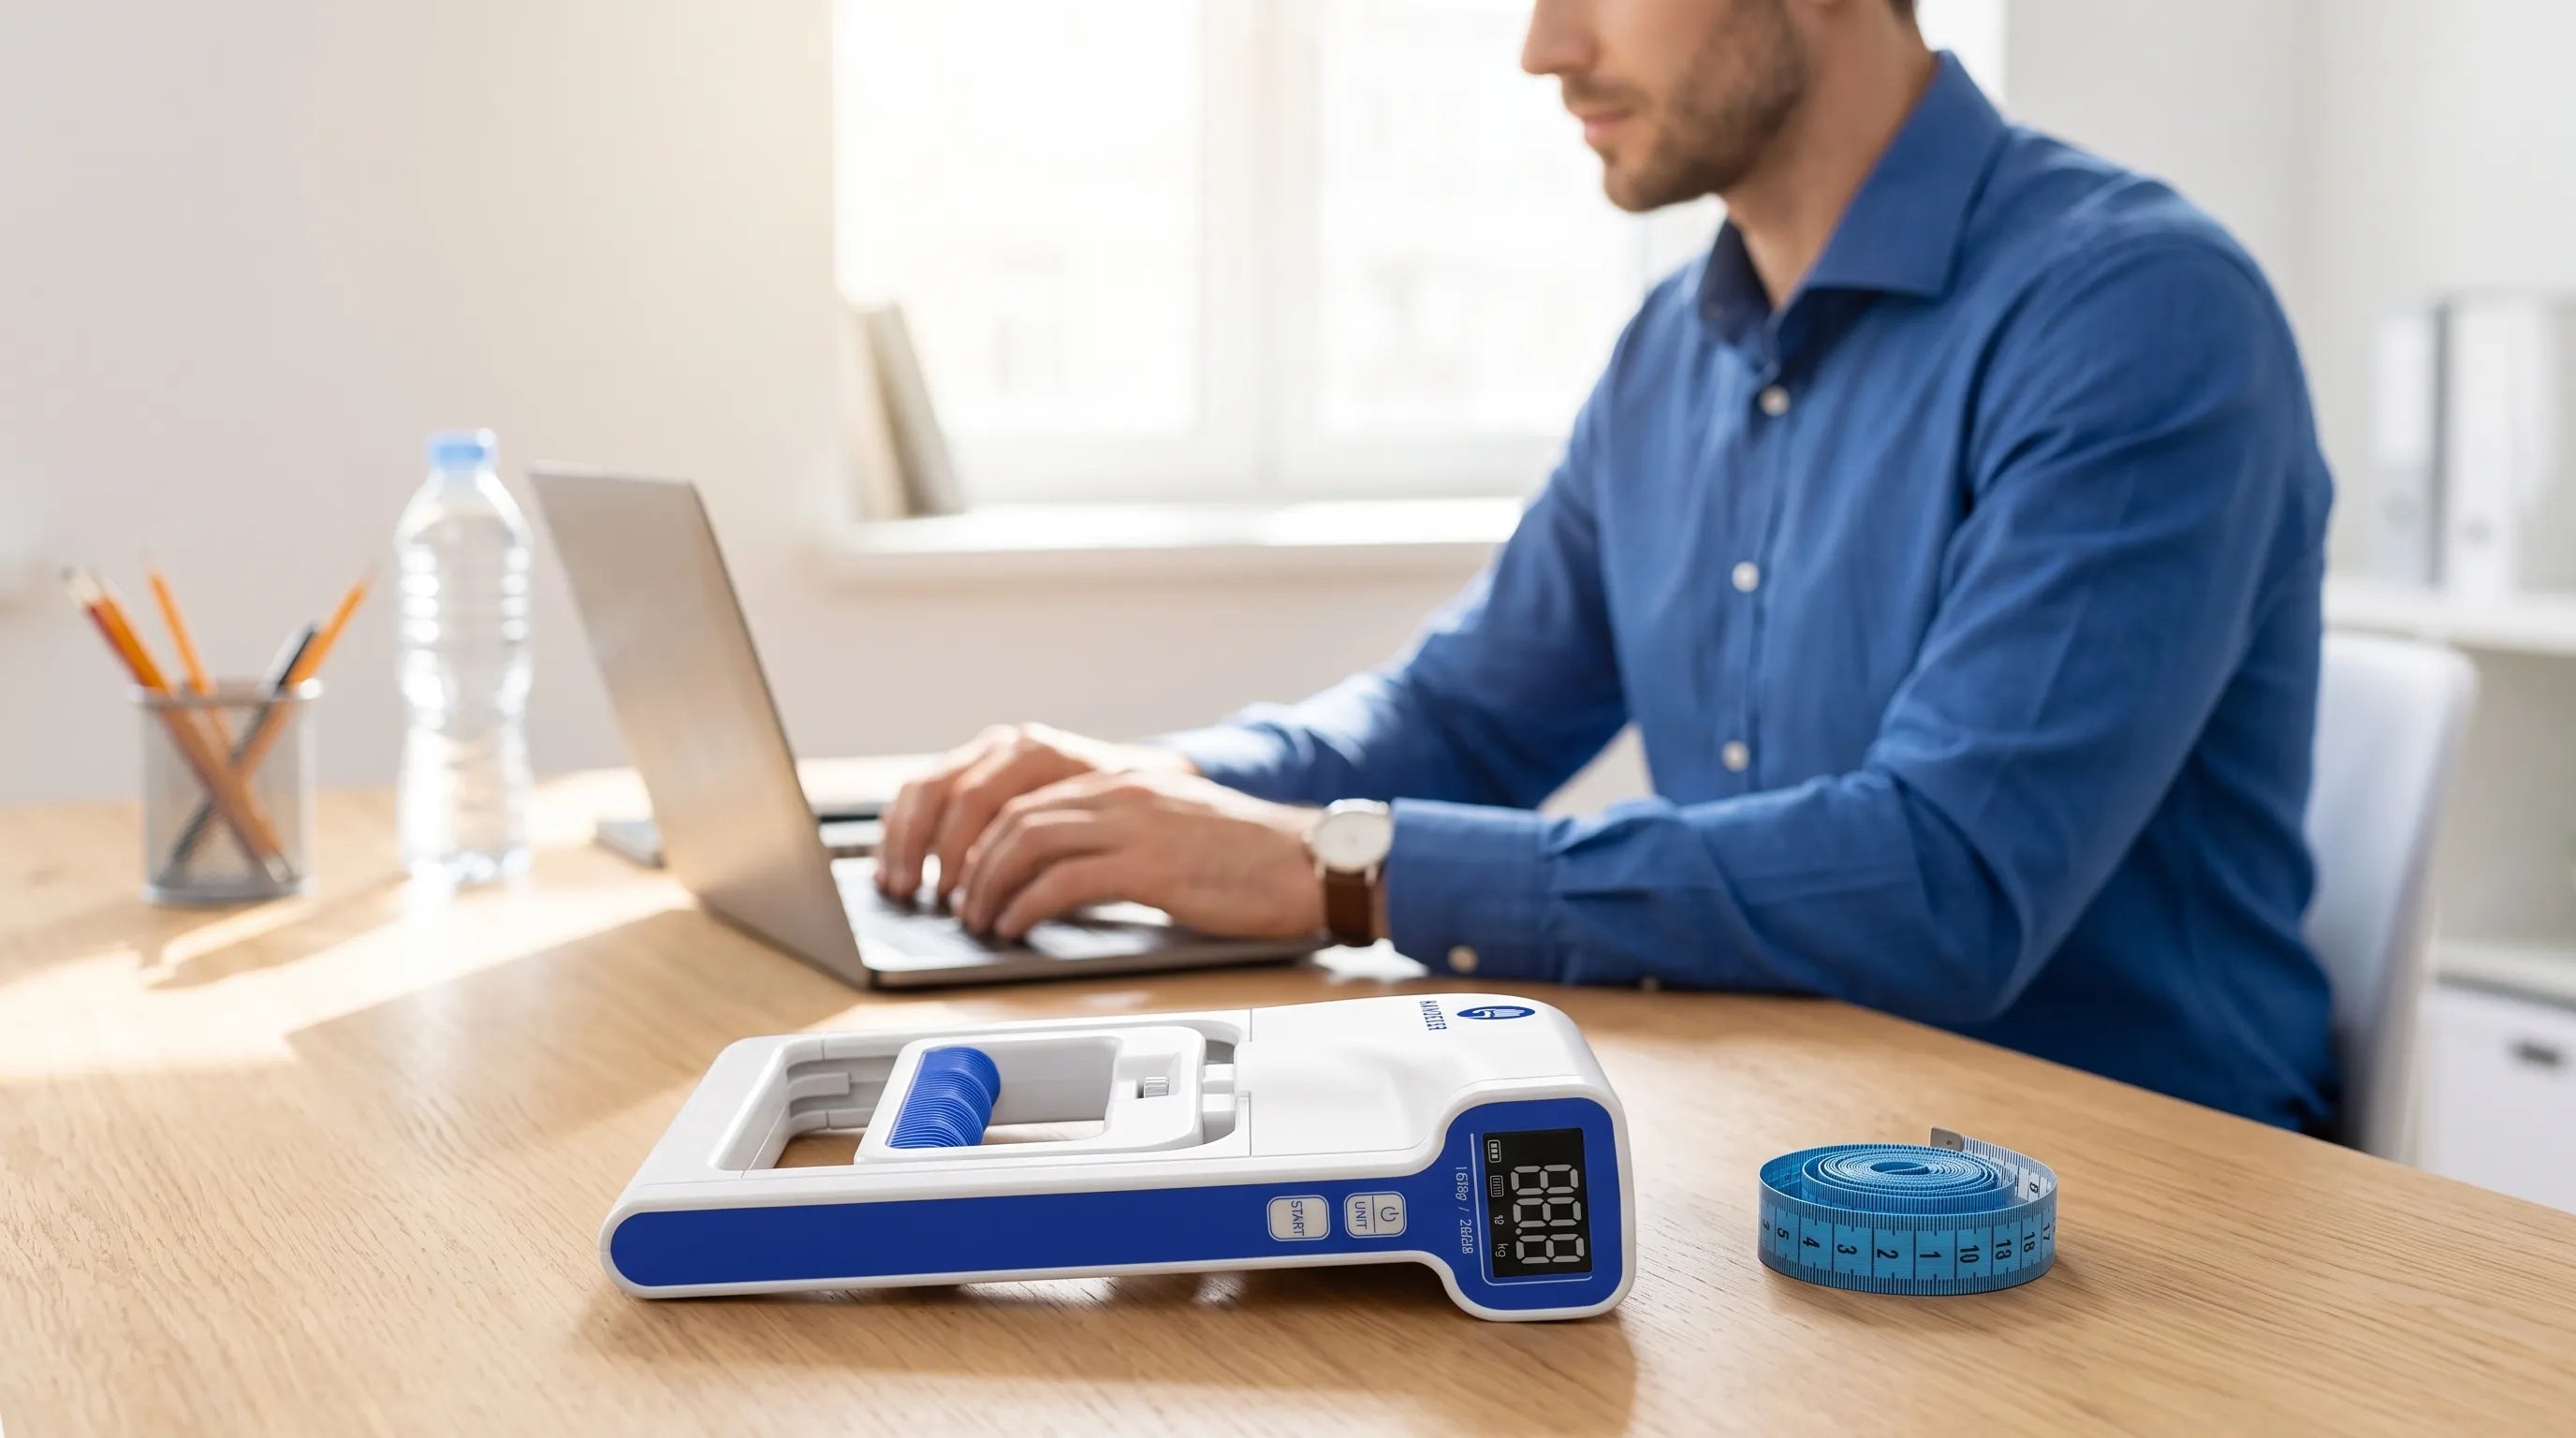
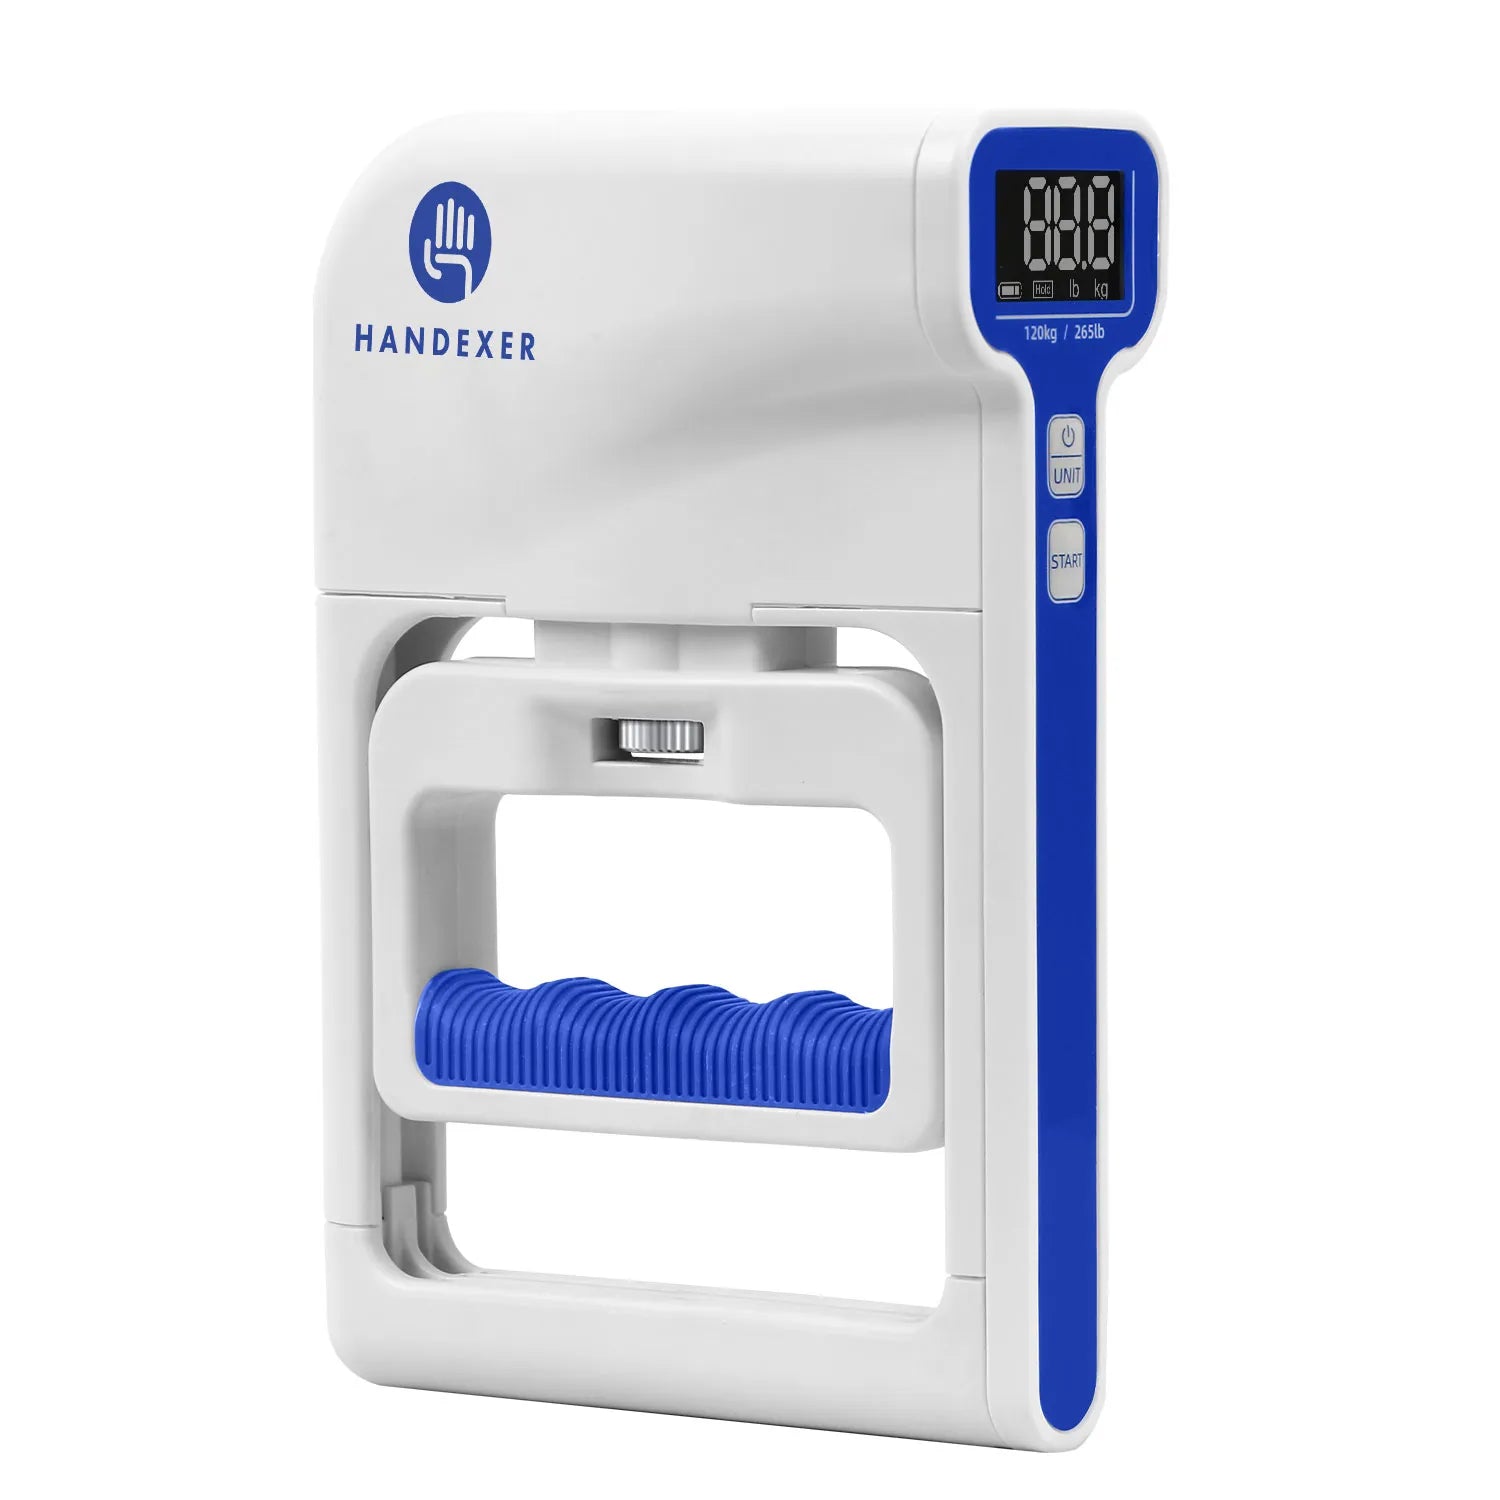
STEP 4 Digital Grip Strength
Age 20–39 Benchmarks
Healthy Target = 40 – 52 kg (Men) | 25 – 34 kg (Women)
Stable Weight Doesn't Always Mean Healthy Muscle
In modern daily life, heavy physical exertion is largely optional. We sit at comfortable desks for hours, take elevators instead of stairs, and rely on automated delivery services.
While convenient, these modern routines can create a subtle illusion: your weight on the bathroom scale may stay completely stable, even as your functional muscle mass quietly declines.
Health professionals often refer to this phenomenon as "silent muscle loss." Because everyday office tasks require minimal force, early muscle attrition rarely triggers immediate warning signs. You do not need peak physical capacity to type on a keyboard or drive a vehicle.
However, entering middle age with normal body weight but low muscle proportion (a state associated with sarcopenic obesity) can reduce your body's physical resilience—making daily exertion feel harder and recovery take longer over time .
Muscle Is More Than Aesthetics: Your Body's Metabolic Engine
Medical literature demonstrates that skeletal muscle typically accounts for 30% to 40% of total body weight. Far from being passive structural tissue, muscle acts as an active endocrine and metabolic support center.
When muscle fibers contract during physical activity, they release helpful chemical signaling proteins known as myokines. According to observational studies, these muscle-derived messengers enter the bloodstream and interact with various organs:
🍃 Glucose Clearance Support
Skeletal muscle is estimated to clear up to
70% to 80% of post-meal blood glucose (
Compr Physiol 2020), supporting healthy insulin sensitivity.
🧠 Brain & BDNF Stimulation
Muscle contraction stimulates BDNF release (
Endocr Rev.), a key protein linked with synaptic plasticity and cognitive health.
🛡️ Amino Acid Reservoir
During periods of physiological stress or recovery, healthy skeletal muscle serves as an essential amino acid backup supply (
Med Sci Sports Exerc.).
The "Pre-35" Window: Your Muscle Savings Account
Large-scale cohort studies (J Cachexia Sarcopenia Muscle) indicate that human muscle mass and density generally reach their peak baseline between ages 20 and 35.
📊 PEAK RESERVE TIMELINE
Peak Muscle Mass Window (Ages 20–35) Maximum Reserve = Long-Term Physical Resilience & Metabolic Capacity
Optimal Building Phase
↓
Natural Gradual Decline Phase (Age 35+) Estimated Inactive Loss: ~3% to 8% Per Decade without active stimulus
Maintenance Required
After age 35, inactive adults may lose approximately 3% to 8% of muscle mass per decade. Evaluating and building your muscle baseline before age 35 acts like a long-term "health savings account," helping preserve physical stamina and independence in later decades.
Step-by-step Home Screening Guide (4 Research-Backed Ways)
Public health frameworks—such as consensus guidelines from the Asian Working Group for Sarcopenia (AWGS 2019)—combine simple anthropometric measurements with functional force metrics to screen muscle health at home without expensive DEXA scans.

1 Check Your BMI (Body Volume Baseline)
Body Mass Index provides a quick baseline for total body volume relative to height.
🧮 CALCULATION METHOD
BMI = Weight (kg) / Height (m)²
Standard metric height & weight
🎯 HEALTHY TARGET
18.5 – 24.9 kg/m²
💡 CLINICAL CONTEXT
Normal BMI with low calf size or grip strength suggests hidden muscle depletion masked by body fat.
2 Check Calf Circumference
Lower-body muscle mass proxy indicator
METHOD A Zero Tools Needed
Finger-Ring Test
Sit with knee at 90°, wrap both hands around the thickest part of your calf using thumb & index finger.
● Healthy Target
Calf is wider than finger ring (fingers cannot touch or just touch).
● Screening Flag
Fingers overlap easily with extra space (potential muscle deficit).
METHOD B Soft Measuring Tape
Clinical Tape Cutoffs
Measure the maximum circumference of your calf horizontally without compressing soft tissue.
MEN TARGET
≥ 34 cm
(13.4 in)
WOMEN TARGET
≥ 33 cm
(13.0 in)
3 Test Peak Digital Grip Strength
Neuromuscular power & upper-body force proxy metric
STANDARDIZED 3-STEP TEST PROTOCOL
1 Elbow bent at 90° seated or standing
2 Max squeeze 3-5 seconds while exhaling
3 Record highest score of 2 attempts
REFERENCE HEALTHY TARGETS & SCREENING FLAGS BMJ Medicine Guidelines
AGE GROUP 20–39 Peak Window
Men
Target: 40 - 52 kg (88-115 lbs) Flag: < 36 kg
Women
Target: 25 - 34 kg (55-75 lbs) Flag: < 22 kg
AGE GROUP 40–59 Mid-Life Window
Men
Target: 36 - 48 kg (79-106 lbs) Flag: < 32 kg
Women
Target: 22 - 30 kg (48-66 lbs) Flag: < 19 kg
💡 Testing Pro-Tip: Keep your wrist neutral and avoid resting the dynamometer against your torso or thigh to ensure pure isometric force measurement.
Want to Know Where Your Muscle Baseline Stands Today?
Stop guessing—use Handexer’s free online Grip Health Assessment & Tracker instead. Just enter your age, gender, and grip strength to instantly calculate your peer percentile ranking and assess your grip health in seconds.
🚀 Test your Grip Health →
Taking Action: From Home Screening to Functional Progress
If your initial self-assessment numbers fall below recommended target ranges, skeletal muscle remains highly adaptable to targeted stimulus at any age:

2
Incorporate Progressive Resistance
Engage in multi-joint compound exercises (such as squats, loaded carries, and pull movements) combined with dedicated hand-grip training 2 to 3 times weekly.
3
Support Muscle Tissue Repair
Ensure adequate daily protein intake (poultry, fish, eggs, tofu, or legumes) alongside consistent sleep to support neurological and muscle fiber recovery.

Frequently Asked Questions (FAQ)
How to test muscle loss at home without a DEXA scan?
You can easily screen for muscle loss at home by combining a simple calf measurement (or the Finger-Ring Test) with a digital grip strength test.
What is the normal grip strength chart by age and gender?
Healthy grip strength varies by age and sex. For adults aged 20–39, healthy targets are typically 40–52 kg for men and 25–34 kg for women. For adults aged 40–59, targets adjust to 36–48 kg for men and 22–30 kg for women. You can view the full clinical bell-curve chart using our
Online Grip Norm Chart.
Why use grip strength instead of leg strength for home sarcopenia screening?
Leg strength is important, but testing it accurately at home requires bulky equipment and carries risk of joint injury. Digital grip strength is safe, easy to measure, and acts as a proven stand-in for your overall body strength—allowing you to track your muscle health easily at home.
Can I improve my grip strength test score without gaining bulky muscle?
Yes. Studies published in the
Medicine & Science in Sports & Exercise highlight that initial gains in grip force stem primarily from neural adaptation—your central nervous system learning to recruit existing muscle fibers more efficiently—allowing you to build functional strength and joint stability without rapid weight gain.
How often should I check my grip strength and muscle mass markers?
Re-testing every 4 to 6 weeks is recommended. Testing daily reflects immediate neural fatigue rather than true physiological adaptation, whereas monthly re-evaluations provide clear, reliable tracking trends.
Where can I read more about the longevity research behind grip force?







Share:
How to Test Grip Strength at Home Accurately: Step-by-Step Guide & Norms
Digital vs. Hydraulic vs. Spring Hand Dynamometers: Comparison 2026 Buying Guide